They say the only constant in life is change, and the past year-and-a-bit has demonstrated this pretty effectively. In the face of all this change, we thought it would be helpful to take a look at the guest feedback data from the first quarter of 2021, and compare it to the same period from the last time life was normal in 2019.

Having relevant, accurate industry benchmarks against which you can compare your property’s performance gives your data context and allows you to make more informed decisions, so we wanted to provide some industry benchmarks for a post-covid world.
We also had some assumptions about what might have changed that we wanted to validate, and a few questions we hoped the data would answer. For example, we were expecting guests to be judging cleanliness more harshly, and we, therefore, anticipated cleanliness scores would be lower. We also wondered if covid precautions would have resulted in guests being less satisfied with certain aspects of their hospitality experience, like check-in procedures or restaurant dining.
To get a relevant data set from which to build these post-covid benchmarks, we looked at data from a selection of our client’s properties that were open for business in the first quarter of both 2019 and 2021. We also removed from consideration clients who had received too few responses to provide meaningful data.
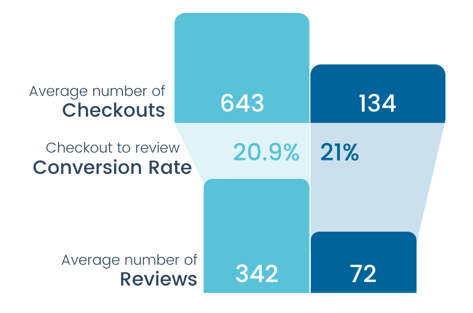
The first thing we looked at was the volume of guests and guest feedback. Although there were obviously far fewer guests in 2021 than there were in 2019, the survey response rate stayed almost identical.
From 2019 to 2021, the number of guests almost halved, with the average number of checkouts per property reduced by 47%. The proportion of guests who went on to complete guest feedback questionnaires was reduced by almost exactly the same amount (46%). In 2019 and in 2021, 20.9 and 21% of guests who checked out went on to complete a guest feedback survey respectively.
Once we knew that the same proportion of guests who stayed at our sample hotels were going on to complete surveys, we then wanted to know if they were as satisfied. Would guests just be so happy to get out of their homes that hotels could do no wrong, or would tedious covid restrictions and precautions ruin the experience entirely?
The answer, guests were just as satisfied travelling in 2021 as they were in 2019. They were also equally likely to recommend their accommodations to a friend or family member.
Amazingly, there was very little difference in the guest ratings for these key performance indicators for 2019 and 2021. The biggest difference was in value for money, and even that was only improved by just under 3%.
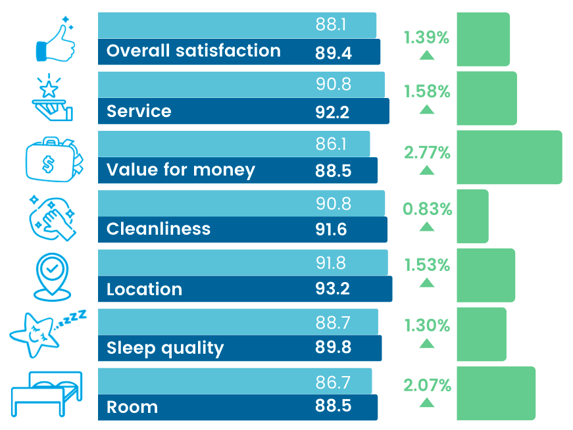
We were most surprised to see that the difference in cleanliness score was negligible. Hoteliers had evidently risen to the challenge of meeting guest expectations surrounding cleanliness in the wake of the pandemic admirably. Considering the attention cleanliness has received in industry publications, and in general, in the wake of covid, we wanted to examine cleanliness scores for specific areas. Were guests more critical of cleanliness in public spaces, or were their rooms receiving harsher critiques?
When we looked at all questions that referenced housekeeping or cleanliness, we found a minuscule 1.7% increase in average rating in 2021 compared to 2019. When we looked at questions that pertain specifically to the common areas of restaurant and bar, there was almost no difference (+0.6%) in average score. However, the average score for room cleanliness dropped by 4.27% in 2021 compared to 2019.
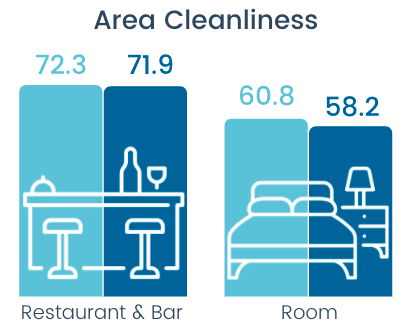
This is by no means a huge drop, but it may indicate that while common areas are receiving increased scrutiny, and increased cleaning protocols, private spaces such as rooms should not be forgotten. Indeed, the cleaner your common spaces are, the higher you set the bar for your private spaces as well.
From the guest feedback available, it’s clear that despite the massive changes that have taken place in the industry and the world, hoteliers have risen to the challenge of anticipating and meeting evolving guest expectations. Nevertheless, the industry has been badly hurt by covid and the resulting lockdowns and travel bans, how will hoteliers encourage more guests through their doors in the future as restrictions begin to be lifted?
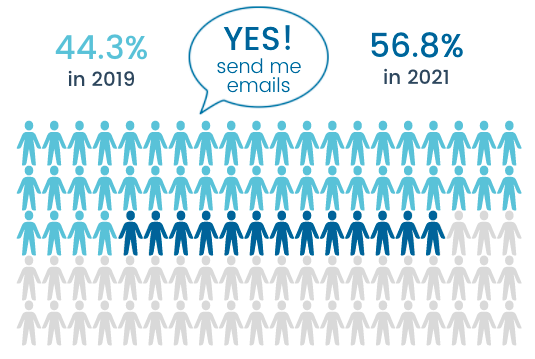
There is good news – the one significant difference in guest feedback from 2019 to 2021 was in answer to the question “Can we send you promotional emails and special offers?”. In 2019, only 44.3% of guests said hotels may do so. In 2021, 56.8% of guests said they would be happy to receive such communications from hoteliers.
In periods of flux and uncertainty, it’s very often your loyal customers who see you through. Keep communicating with your guests, and use your data to ensure that this communication is tailored to those guests.
By using your guest feedback information to tailor your product offering to the market that is most likely to return soonest to your property, and then targeting those people with communication that is timely and relevant, you stand your hotel in good stead to recover as quickly as possible.
Upon analysis, the most remarkable thing about this data is how unremarkable it is. Despite all that’s changed since Covid hit, guest feedback has remained surprisingly constant. In the face of a world that can be dauntingly different from the one we left over a year ago, we hope that hoteliers will take some comfort knowing that the guests they are welcoming through their doors are after the same thing they were before – a great hospitality experience – and good hoteliers are still equipped to provide that (with a few small modifications).


